TherMOOstat Data — Value for TowerWatch How the 2026-04-15 Facilities Management data handoff feeds the California Energy Map and the BWFP microgrid thesis work
1. Executive summary
- 29,258 occupant comfort reports across 399 buildings (2016–2026) are now queryable alongside our PI historian, CEED monthly billing, and CIMIS weather data—enabling the first campus-scale human-labeled HVAC fault dataset TowerWatch has had access to.
- 6,744 rows carry Facilities-written "Mechanical Notes", and 2,981 BAS PointMemos (back to the 1990s) document every recorded setpoint change in the Desigo BMS. That is a rare commodity: ground-truth labels linking a complaint to an equipment response.
- Hiroko Masuda's handoff is explicit and bounded. The CSV, SkySpark
recs.zinc(154 MB), and personal Airtable copy are ours to analyze freely. The production Airtable base remains read-only. The personal copy drops rows past the 1,000-row cap on ~2026-05-16—so the CSV is the durable source of truth. - TowerWatch-specific leverage: occupant reports are a direct false-positive gate for our PI anomaly detector, a supervised label source for a complaint classifier, and a missing human-signal layer on the California Energy Map.
2. The data package
Hiroko Masuda (UC Davis Facilities Management) delivered the HVAC Knowledge Repository data package by email on 2026-04-15 at 5:49 PM PDT, following the 2026-04-14 introductory Teams meeting. The email is preserved at data/thermoostat/email_threads/2026-04-15_hiroko_hvac_repo_intro.pdf. Three primary files plus five Airtable CSV exports plus an attachment corpus.
| File | Size | Rows / count | Landed as |
|---|---|---|---|
Feedback_2016-04-15.csv filename typo: 2016→2026 |
— | 36,337 rows × 45 cols (superset of Airtable copy) | thermoostat_feedback_raw |
PointMemos - All data.xlsx |
— | 2,981 BAS setpoint-change memos (Sheet5) | thermoostat_bas_pointmemos_raw |
recs.zinc + arc/*.trio |
154 MB | 547 trio files; full Desigo site/equip/points tree | explored/TherMOOstat/export-recs/ |
| Airtable CSVs (Feedback, Room Inventory, Comfort Band, Response Templates, In-Depth Investigation) | — | 29,258 + 52 + 18 + 13 + 4 rows | thermoostat_airtable.duckdb |
| Airtable-attached photos (harvested via signed URLs) | — | 166 manifest entries; 163 vision-analyzed; 154 OK | explored/TherMOOstat/_photos/ |
| Teams meeting (2026-04-14) | 15 MB / 68 MB | Audio + transcript–deck PDF | ~/Downloads/HVAC Repository Introductory Meeting/ |
The figures above are queried live from artifacts/local/thermoostat_airtable.duckdb at report generation. Dates on the Airtable feedback mirror span 2016-01-03 to 2026-04-15.
2.1 Temporal coverage
| Year | Reports | Year | Reports |
|---|---|---|---|
| 2016 | 3,420 | 2022 | 1,958 |
| 2017 | 4,326 | 2023 | 2,078 |
| 2018 | 5,281 | 2024 | 2,080 |
| 2019 | 5,783 | 2025 | 1,796 |
| 2020 | 1,207 COVID depopulation | 2026 YTD | 440 |
| 2021 | 881 | ||
The 2020–2021 trough aligns with campus depopulation and is itself a useful signal—a baseline period where occupant-driven HVAC stress was near zero.
2.2 Comfort distribution
| Sentiment | n | % | Interpretation |
|---|---|---|---|
| Hot | 9,337 | 31.9% | Strong negative, cooling-side fault candidate |
| Cold | 8,774 | 30.0% | Strong negative, heating-side or over-cooling |
| Chilly | 4,528 | 15.5% | Mild negative |
| Warm | 3,676 | 12.6% | Mild negative |
| Perfect | 2,819 | 9.6% | Positive — valuable counter-example |
| null | 124 | 0.4% | Incomplete submissions |
2.3 Top 10 buildings by reporting volume
| Building | Reports | Hot/Warm | Cold/Chilly | Skew |
|---|---|---|---|---|
| Wellman Hall | 2,005 | 905 | 901 | Balanced — whole-building dispatch issue, not seasonal bias |
| Olson Hall | 1,353 | 885 | 375 | 2.4× hot-skew — likely over-heated zones / solar gain |
| Young Hall | 1,269 | 628 | 590 | Balanced |
| Haring Hall | 1,197 | 540 | 636 | Cold-leaning |
| Shields Library | 988 | 293 | 524 | 1.8× cold-skew — over-cooling / stack effect |
| Giedt Hall | 974 | 432 | 372 | Balanced |
| Hunt Hall | 681 | 173 | 480 | 2.8× cold-skew |
| Valley Hall | 669 | 208 | 439 | 2.1× cold-skew |
| Kemper Hall | 650 | 196 | 411 | 2.1× cold-skew |
| Hoagland Hall | 622 | 203 | 395 | 1.9× cold-skew |
These skews are the kind of summary stat that currently lives only in Hiroko's head. Once materialized in TowerWatch alongside the PI anomaly score, they become a lookup a Facilities intern or the HVAC chatbot can cite before rolling a truck.
2.4 Attachment corpus — what the 163 vision-analyzed photos show
| Category | n | What it is |
|---|---|---|
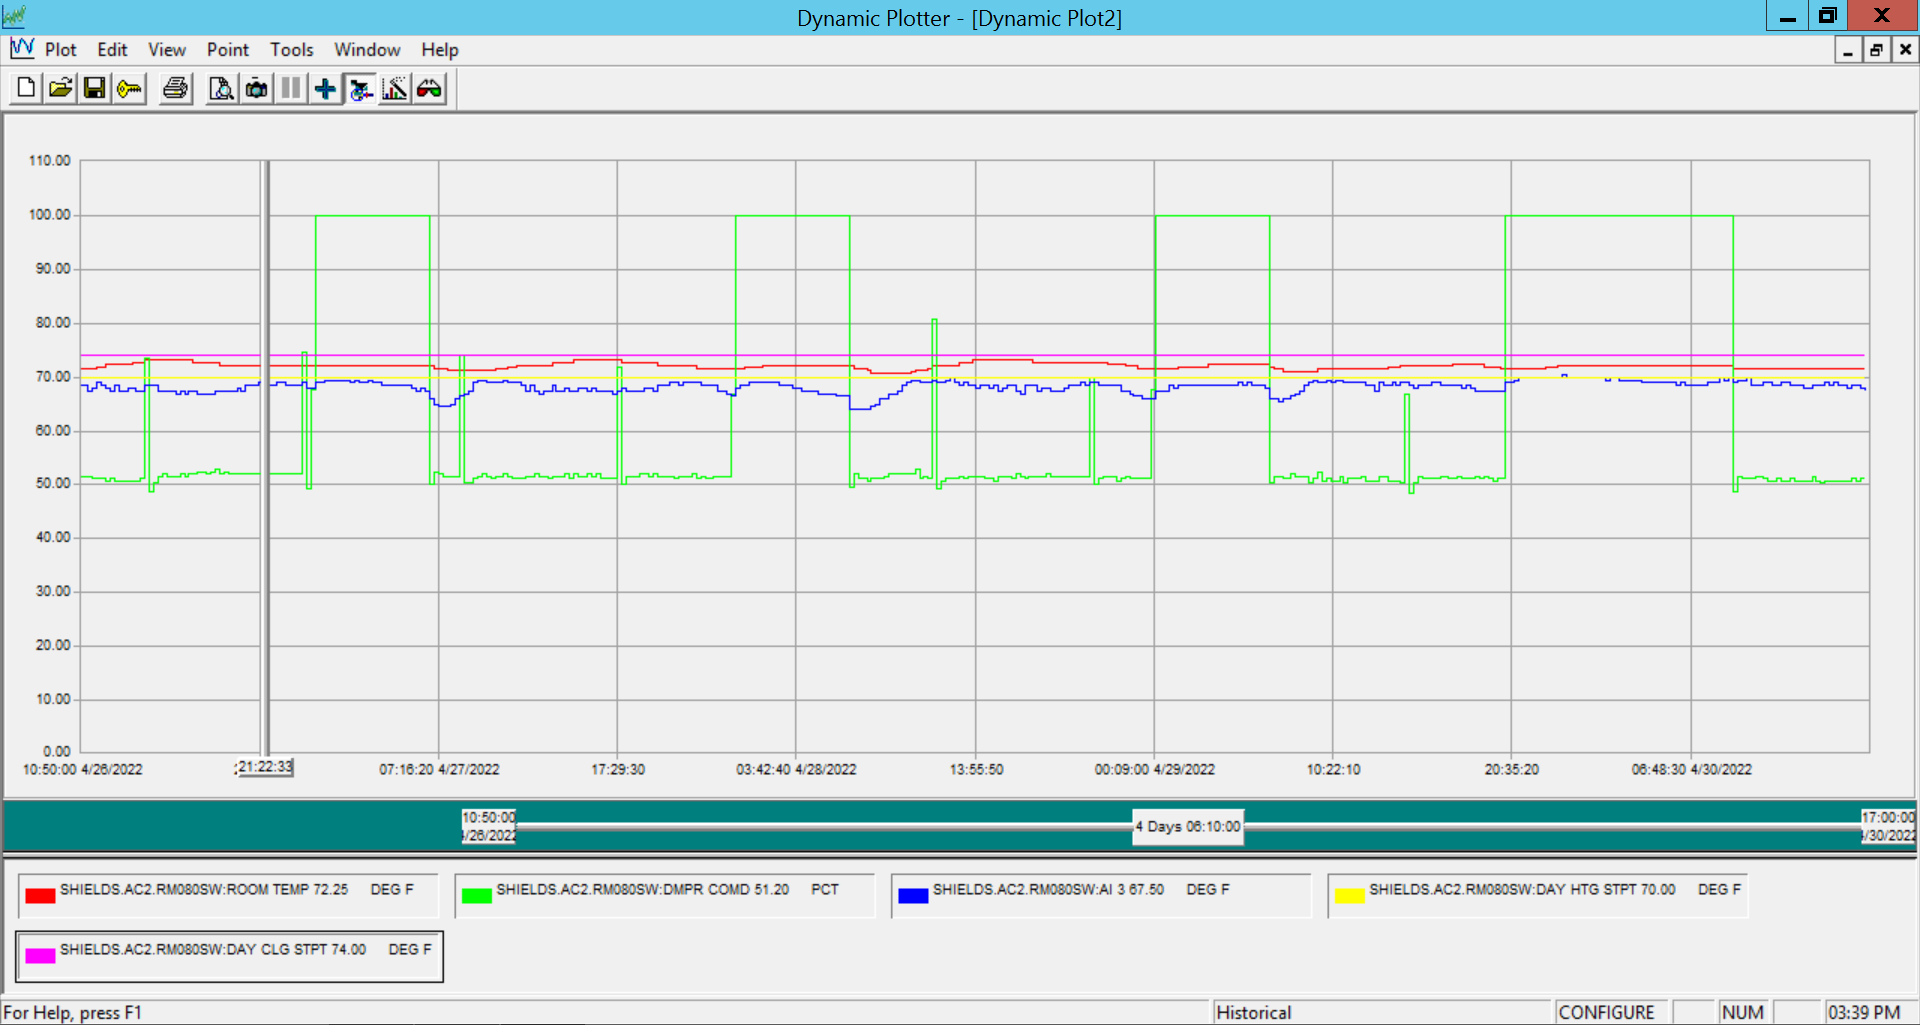
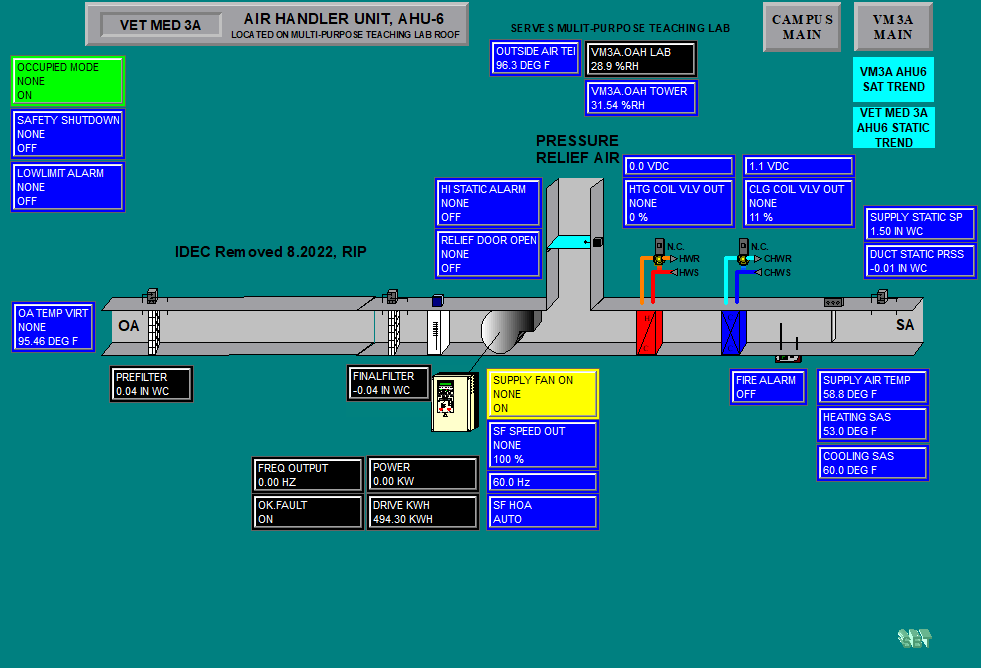
| hvac_chart_screenshot | 91 | Desigo Dynamic Plotter / SkySpark trends attached by FM triagers to document a diagnosis |
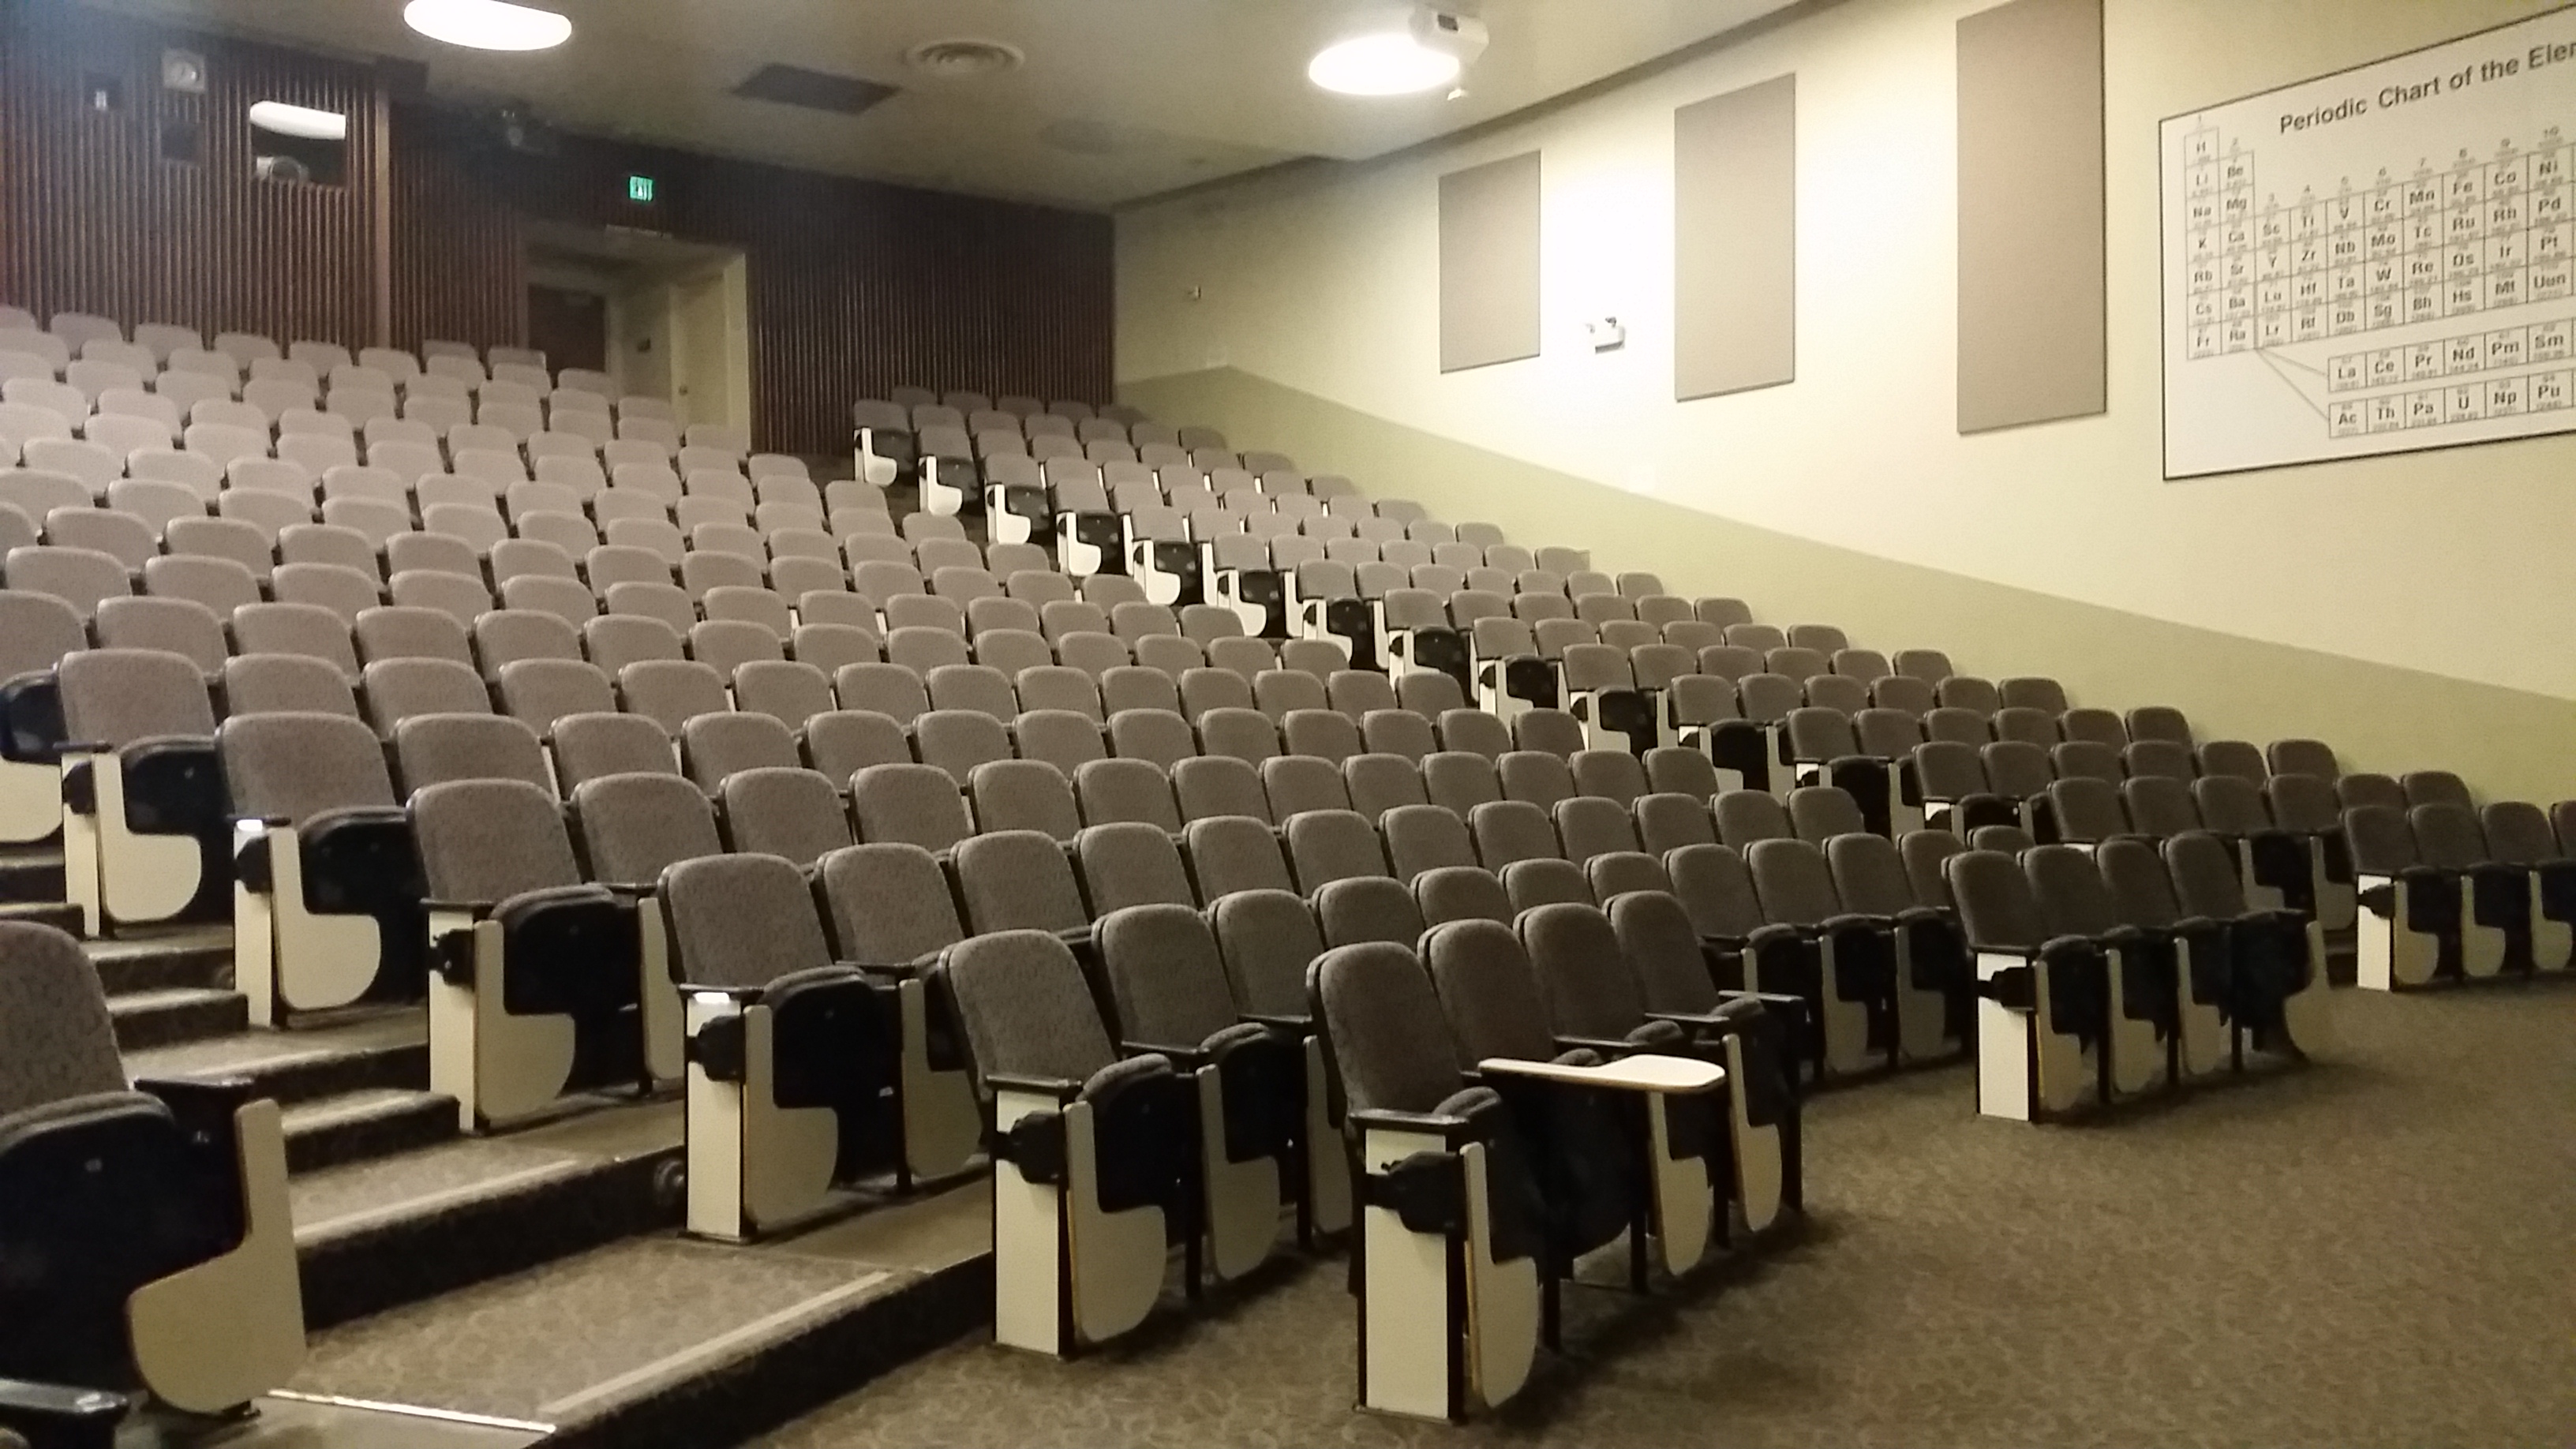
| room_photo | 29 | Classroom / lab snapshot from Room Inventory audits |
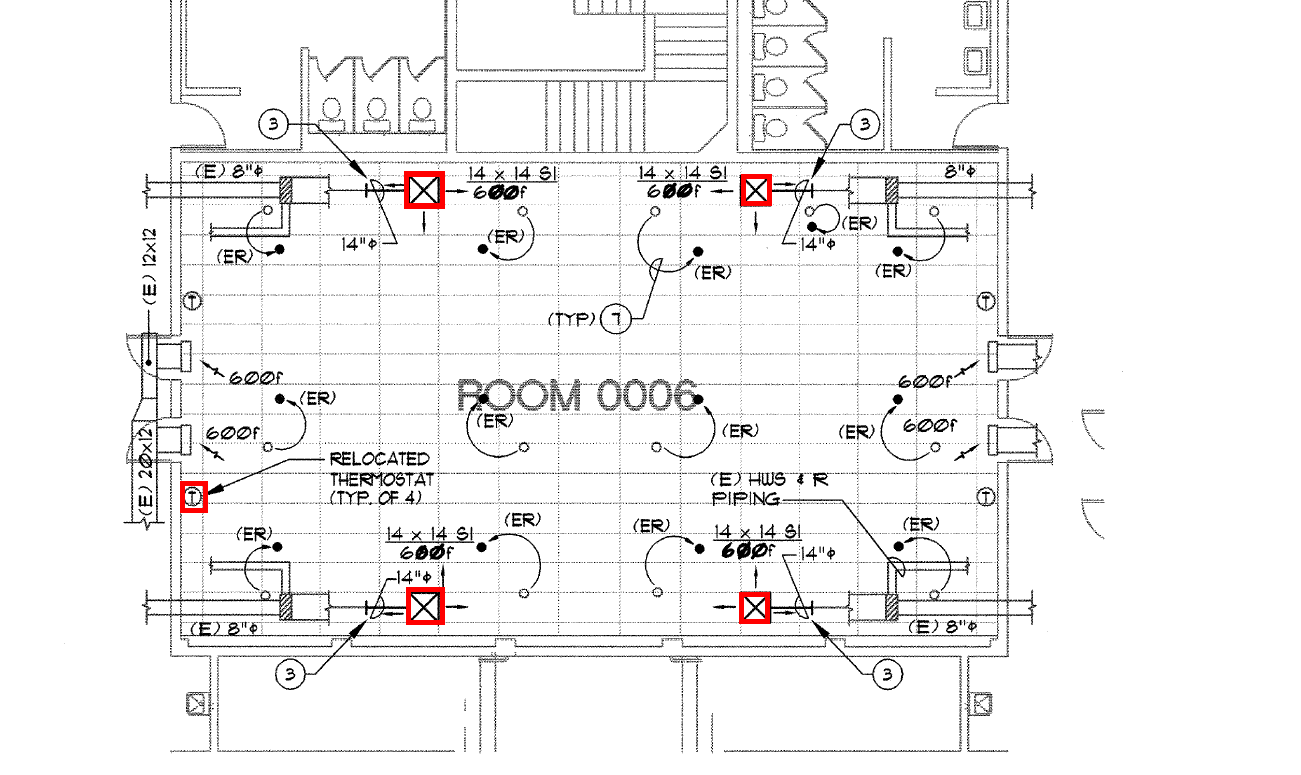
| vent_grille | 24 | Scanned seating plans / ceiling diagrams with vent and thermostat positions annotated |
| other | 12 | Misc — email chains, signage, hallways |
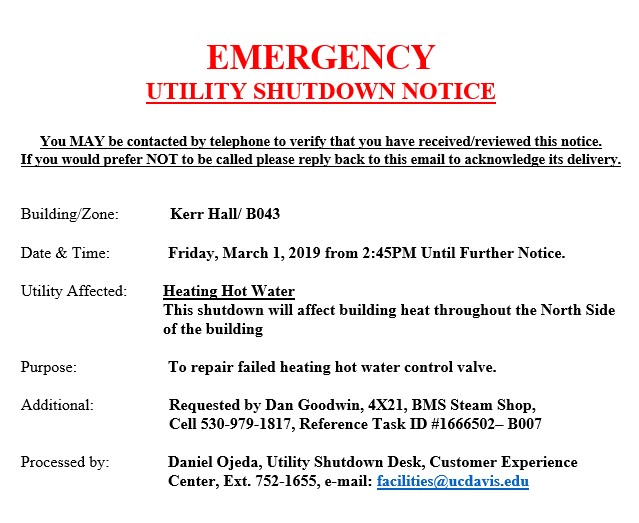
| work_order | 4 | TRIRIGA / Utility Shutdown notices attached to correlated complaint |
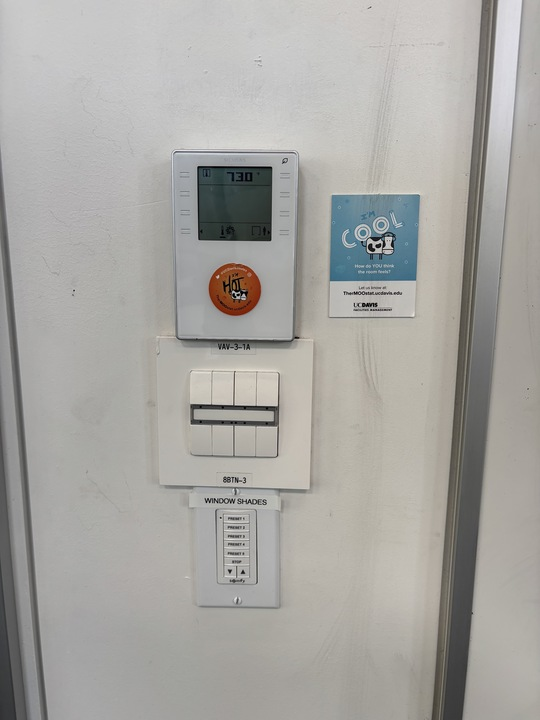
| thermostat_closeup | 3 | Wall-mounted setpoint/VAV displays |
Photo categorization runs via scripts/analyze_thermoostat_images.py using Copilot gpt-5-mini in vision mode ($0 with our subscription). OCR is side-effect data that seeds the comment-text extraction pipeline (§3e).
3. Five research directions this unlocks
3a. Occupant-comfort × PI anomaly correlation
Feature: Comfort-validated anomaly score. Join each thermoostat_feedback row to PI zone temperature / VAV damper / reheat valve history for the reporting zone within a ±30 min window, and compute a pairwise agreement score per building. Where the human comfort signal agrees with the PI deviation, anomaly confidence goes up; where they disagree, a false-positive / false-negative flag goes up.
Data join: airtable_thermoostat_feedback.fields.Building Name → config/pi_building_aliases.json → measurements(building, metric, ts) in the main energy DuckDB. Hart Hall / Olson / Wellman already carry rich PI instrumentation. Hunt Hall's 2.8× cold-skew pattern is a test case: correlate to the actual zone-temp distribution to see whether the building is truly over-cooled or whether reporting is dominated by one mis-sensed zone.
Product surface: a per-building overlay on the California Energy Map—a dot or ring whose radius encodes feedback volume and whose color encodes comfort–anomaly agreement.
3b. False-positive vetting ML (PMV self-consistency, contrariness scoring)
Feature: Per-row reliability score computed as specified in docs/THERMOOSTAT_REVERSE_ENGINEERING.md §4.1. The schema provides seven native FP signals (notCurrentlyHere, slightChange, isComplete, sessionClosed, clothing, activity, comment length) plus a learned per-user track record keyed on ucdPersonUuid.
Data join: the CSV carries Clothing Level, Physical Activity, and Deviation from Set Point in every row, so the PMV self-consistency check (does the reported sentiment match the ASHRAE predicted mean vote given the clothing / activity / zone temp?) can run purely on existing columns. The Bayesian reporter track-record needs the hashed UUID (kept inside the CAS-authenticated flow only for privacy).
Product surface: the confidence-ring UI on hvac-triage.html — green for ground-truth, yellow for needs-corroboration, grey for data-collection-only.
3c. Equipment-referenced maintenance from LLM-parsed PointMemos
Feature: Setpoint-change timeline per room. The 2,981 memos are "messy and cryptic" (Hiroko's words) and describe old-setpoint → new-setpoint changes with dates and initials going back to the 1990s. Parsing them with scripts/interpret_thermoostat_pointmemos.py (Copilot gpt-5-mini, free) yields thermoostat_bas_pointmemos_parsed with structured columns: room_or_equip, old_value, new_value, units, changed_at, author, direction.
Data join: memo → Room Inventory record → recs.zinc equipment tree. This is the only known source of human-narrated reasoning behind BMS parameter changes—invaluable for the HVAC chatbot's training set.
Surface: a "what Facilities has already done in this room" panel on the building detail page, and a Haystack-gap table for points that exist in PointMemos but are not visible in SkySpark (thermoostat_bas_haystack_gap).
3d. Comment-text symptom extraction (3-stage pipeline)
Feature: Symptom taxonomy attached to every commented report. 8,658 of 29,258 rows (29.6%) carry a free-text comment. Three-stage pipeline from the RE spec §6:
- Rules — regex for high-frequency phrasings ("freezing", "no air", "vent blowing hot", "chilly since morning"). Cheap, catches ~60%.
- Embeddings — cluster residuals with sentence-transformers to surface novel symptom families not in the rule list.
- LLM — per-cluster LLM tagging with a fixed symptom schema (airflow-none, thermal-runaway, draft, noise, cycling, ...). Copilot gpt-5-mini at $0.
Data join: extracted symptoms → building + equipment → matching PI anomaly window. This is the supervised signal the HVAC chatbot's retrieval-augmented generation indexes against.
3e. Autonomous corrective action envelope (closed-loop, Phase-gated)
Feature: the Phase 0 → Phase 4 deployment ladder from RE spec §10—from passive insight to narrow autonomous action.
| Phase | Authority | What TowerWatch does |
|---|---|---|
| 0 | Read-only | Ingest, score, dashboard; no writes anywhere |
| 1 | Recommend | Suggest TRIRIGA work-order drafts to FM, no submission |
| 2 | Author-assist | Pre-populate TRIRIGA forms; FM hits submit |
| 3 | Narrow autonomy | Setpoint nudges within a bounded Comfort Band (sourced from airtable_thermoostat_comfort_band, 18 rows today) |
| 4 | Portfolio autonomy | Cross-building scheduling + demand-response coordination |
The Airtable base already carries an explicit Comfort Band table with 18 approved temperature bands per room, previous heating setpoint, and previous cooling setpoint. That is the literal envelope for Phase 3 automation—Facilities has already codified the allowed action space.
4. Measurement artifacts we must handle
Three data-reality drifts were surfaced in the 2026-04-14 Teams meeting with Brian Lima (Facilities Energy). Every join and every automated action must account for them.
4.1 Room-number drift
Occupant reports a room number that has since been renumbered during a remodel; the BMS still uses the old number. TowerWatch services/comfort_feedback_joiner.py must resolve reported room ↔ BMS identifier before any join. Room Inventory (airtable_thermoostat_room_inventory, 52 rows) is our resolution table today; will need expansion to the full 15,528-room campus.
4.2 Multi-zone master-sensor confusion
Brian, meeting @ 1:16:30: a single physical sensor can govern multiple nominal rooms. Complaints from Room N may legitimately implicate a sensor physically located in Room M. Dispatching a tech to N to check "the thermostat" is the wrong action when the governing sensor is elsewhere.
4.3 Solar ricochet
Brian, meeting @ 1:18:11: rooftop PV arrays (the kind now common on adjacent buildings after the 2019 expansion) can reflect direct solar onto envelope sensors of neighboring structures, producing thermal anomalies that look like HVAC faults but are measurement artifacts. The False-Positive vetting layer needs a geometry check against /api/simcity/overlays/solar-pv.geojson to flag at-risk sensor positions.
5. Institutional value — why UC Davis Facilities gave us this
Hiroko's handoff was made in the context of the HVAC Knowledge Repository project (Net Zero class, Spring 2026; client: Facilities Management; co-contacts Nicolas Fauchier-Magnan and Kiernan). The deliverables Facilities asked for are:
- Clean TherMOOstat feedback + work orders + building metadata
- AI-extracted patterns (complaint → root cause → fix)
- Structured knowledge base (issue → causes → checks → actions)
- Chatbot / search tool for technicians and interns
- Training guide for interns
Every one of those is a TowerWatch feature in disguise. The chatbot is a bounded LLM agent with RAG over the comment / memo / screenshot corpus. The "training guide" is a reproducible notebook. The "structured knowledge base" is a DuckDB star schema keyed on building and equipment.
From the campus side, we give back:
- A searchable, filterable view of 10 years of their own feedback data, joined to BMS setpoint history and live PI telemetry.
- A vetted triage queue that cuts through false positives — particularly the repeat-reporter and cluster-of-one patterns Facilities currently has no tooling for.
- A reusable platform: the same stack serves interns this quarter, Josh Morejohn's fault-rule work, and any subsequent cohort.
6. Constraints, deadlines, and handling stance
6.1 Read-only observer on the production Airtable base
The production base (Hiroko's TherMOOnalysis copy) is consumed read-only. Token scope stays effectively schema.bases:read + data.records:read. No Extensions, no Blocks, no automations, no writes of any kind, no outbound actions reaching Hiroko's team, no UI surfaces they can see. The cost of an unauthorized write is the relationship, which is not recoverable.
6.2 The 2026-05-16 deadline on the personal-copy Airtable
Hiroko's personal Airtable workspace has a 1,000-record free-tier cap. She copied the base on 2026-04-15 to share it with us; she has 31 days before records above the cap start dropping. Earliest consequence date: ~2026-05-16.
Feedback_2016-04-15.csv export is the canonical source. The Airtable personal copy is a convenience browse surface only. After 2026-05-16 it becomes a truncated view. We do not build any pipeline that depends on the live personal Airtable beyond that date.
6.3 Explicit authorizations (2026-04-15 email)
- Personal Airtable copy: “feel free to use it however you like.” (Applies to the copy only.)
recs.zinc: “I recommend throwing the file into an AI chat. It will interpret the database very well.”- PointMemos: explicitly authorized for LLM parsing and integration into a student-facing support tool.
7. Photo gallery — the signal this data carries
Six photos selected from the 163 vision-analyzed attachments. Each illustrates a distinct class of signal that lives in the dataset.
Appendix A — Data flow
Appendix B — Representative comment shape (illustrative)
Raw comments are not shown to protect reporter privacy. The following are fictional-but-representative examples in the shape of the 8,658 commented rows — they mirror the vocabulary and length distribution we see in the corpus:
“Freezing since I got here at 8am, south windows, vent blowing hard”
“Radiant panel never came on, first class of the quarter, radiator noise”
“Room is fine now but was brutally hot all last week, just logging it”
The third example is a case where notCurrentlyHere = true and previouslyHereDate carries the actual complaint window — an easy false-positive trap if the retrospective flag is not read.
Appendix C — Files and scripts
| Path | Purpose |
|---|---|
artifacts/local/thermoostat_airtable.duckdb | 5 Airtable mirror tables + photo manifest + vision-analysis results |
artifacts/local/energy_pipeline.duckdb | CSV-sourced thermoostat_feedback_raw + PointMemos + haystack gap |
explored/TherMOOstat/export-recs/ | SkySpark zinc/trio export (154 MB, 547 trio files) |
explored/TherMOOstat/_photos/ | Harvested Airtable attachments (expired signed URLs; do not re-harvest) |
docs/THERMOOSTAT_REVERSE_ENGINEERING.md | 1,376-line spec: 35-field schema, FP reliability, PMV, Phase 0–4 plan |
scripts/ingest_thermoostat_raw.py | Feedback CSV → DuckDB raw table |
scripts/ingest_thermoostat_pointmemos.py | PointMemos xlsx ingest + haystack-gap analysis |
scripts/interpret_thermoostat_pointmemos.py | Copilot gpt-5-mini batch parser of cryptic memos |
scripts/harvest_thermoostat_photos.py | Airtable signed-URL downloader (URLs expire 24–48h) |
scripts/analyze_thermoostat_images.py | Vision categorization + OCR per attachment |
services/comfort_feedback_joiner.py | (planned) feedback ↔ PI anomaly join with drift handling |